TreeSurrogate fits a decision tree on the predictions of a prediction model.
Details
A conditional inference tree is fitted on the predicted \(\hat{y}\) from
the machine learning model and the data. The partykit package and
function are used to fit the tree. By default a tree of maximum depth of 2 is
fitted to improve interpretability.
To learn more about global surrogate models, read the Interpretable Machine Learning book: https://christophm.github.io/interpretable-ml-book/global.html
References
Craven, M., & Shavlik, J. W. (1996). Extracting tree-structured representations of trained networks. In Advances in neural information processing systems (pp. 24-30).
See also
predict.TreeSurrogate plot.TreeSurrogate
For the tree implementation
partykit::ctree()
Super class
iml::InterpretationMethod -> TreeSurrogate
Public fields
treeparty
The fitted tree. See also partykit::ctree.maxdepthnumeric(1)
The maximum tree depth.r.squarednumeric(1|n.classes)
R squared measures how well the decision tree approximates the underlying model. It is calculated as 1 - (variance of prediction differences / variance of black box model predictions). For the multi-class case, r.squared contains one measure per class.
Methods
Inherited methods
Method new()
Create a TreeSurrogate object
Usage
TreeSurrogate$new(predictor, maxdepth = 2, tree.args = NULL)Arguments
predictorPredictor
The object (created withPredictor$new()) holding the machine learning model and the data.maxdepthnumeric(1)
The maximum depth of the tree. Default is 2.tree.args(named list)
Further arguments forparty::ctree().
Method predict()
Predict new data with the tree. See also predict.TreeSurrogate
Arguments
newdatadata.frame
Data to predict on.typePrediction type.
...Further arguments passed to
predict().
Examples
library("randomForest")
# Fit a Random Forest on the Boston housing data set
data("Boston", package = "MASS")
rf <- randomForest(medv ~ ., data = Boston, ntree = 50)
# Create a model object
mod <- Predictor$new(rf, data = Boston[-which(names(Boston) == "medv")])

# Fit a decision tree as a surrogate for the whole random forest
dt <- TreeSurrogate$new(mod)
#> Loading required package: partykit
#> Loading required package: libcoin
#> Loading required package: mvtnorm

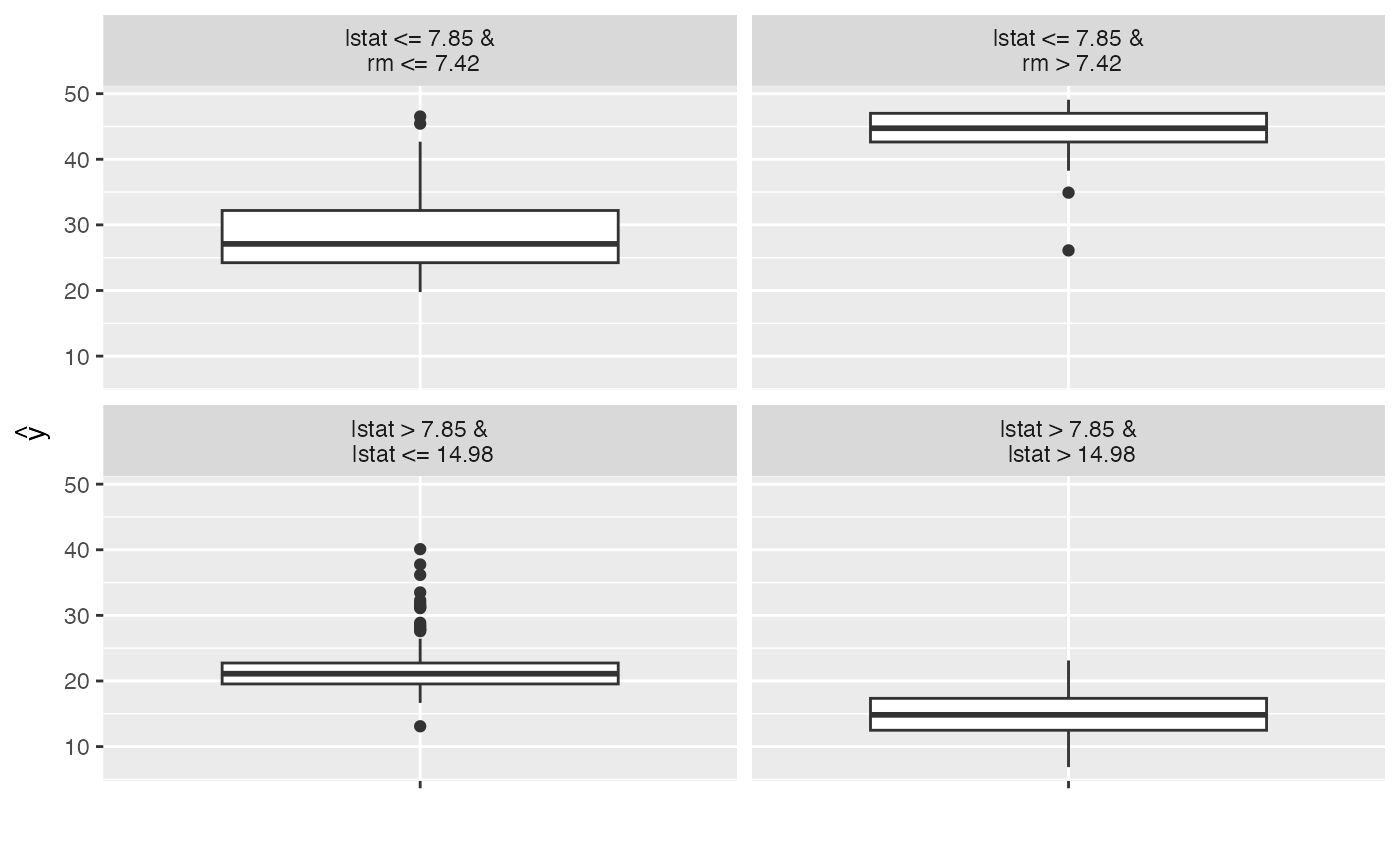
# Plot the resulting leaf nodes
plot(dt)


# Use the tree to predict new data
predict(dt, Boston[1:10, ])
#> Warning: Dropping additional columns: medv
#>      .y.hat
#> 1  28.40739
#> 2  21.79798
#> 3  28.40739
#> 4  28.40739
#> 5  28.40739
#> 6  28.40739
#> 7  21.79798
#> 8  14.89175
#> 9  14.89175
#> 10 14.89175

# Extract the results
dat <- dt$results
head(dat)
#>      crim zn indus chas   nox    rm  age    dis rad tax ptratio  black lstat
#> 1 0.00632 18  2.31    0 0.538 6.575 65.2 4.0900   1 296    15.3 396.90  4.98
#> 2 0.02731  0  7.07    0 0.469 6.421 78.9 4.9671   2 242    17.8 396.90  9.14
#> 3 0.02729  0  7.07    0 0.469 7.185 61.1 4.9671   2 242    17.8 392.83  4.03
#> 4 0.03237  0  2.18    0 0.458 6.998 45.8 6.0622   3 222    18.7 394.63  2.94
#> 5 0.06905  0  2.18    0 0.458 7.147 54.2 6.0622   3 222    18.7 396.90  5.33
#> 6 0.02985  0  2.18    0 0.458 6.430 58.7 6.0622   3 222    18.7 394.12  5.21
#>   .node                           .path   .y.hat .y.hat.tree
#> 1     3    lstat <= 7.85 &\n rm <= 7.42 26.37877    28.40739
#> 2     6 lstat > 7.85 &\n lstat <= 14.98 21.87040    21.79798
#> 3     3    lstat <= 7.85 &\n rm <= 7.42 35.96117    28.40739
#> 4     3    lstat <= 7.85 &\n rm <= 7.42 34.84077    28.40739
#> 5     3    lstat <= 7.85 &\n rm <= 7.42 35.47810    28.40739
#> 6     3    lstat <= 7.85 &\n rm <= 7.42 27.78297    28.40739

# It also works for classification
rf <- randomForest(Species ~ ., data = iris, ntree = 50)
X <- iris[-which(names(iris) == "Species")]
mod <- Predictor$new(rf, data = X, type = "prob")

# Fit a decision tree as a surrogate for the whole random forest
dt <- TreeSurrogate$new(mod, maxdepth = 2)

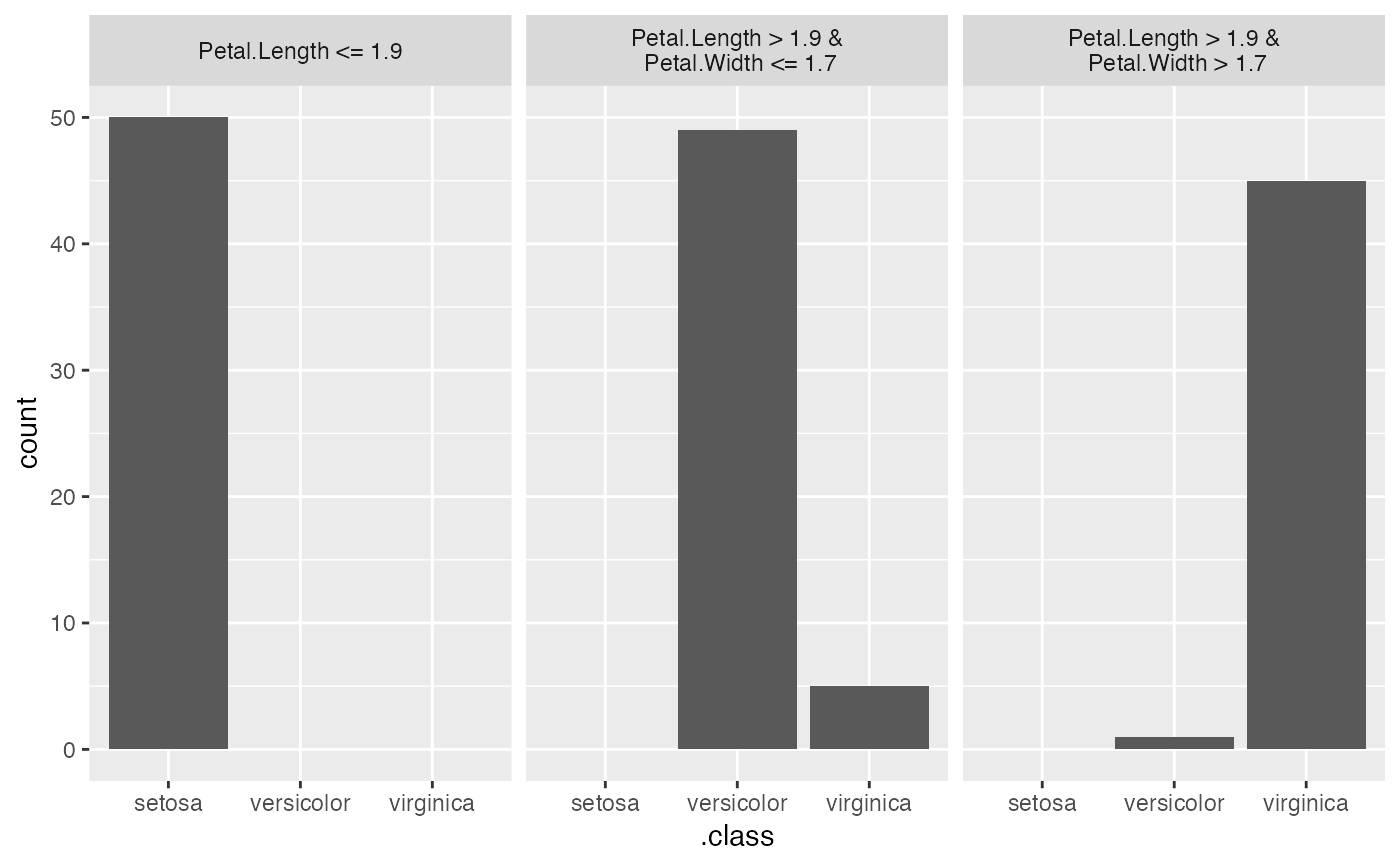
# Plot the resulting leaf nodes
plot(dt)


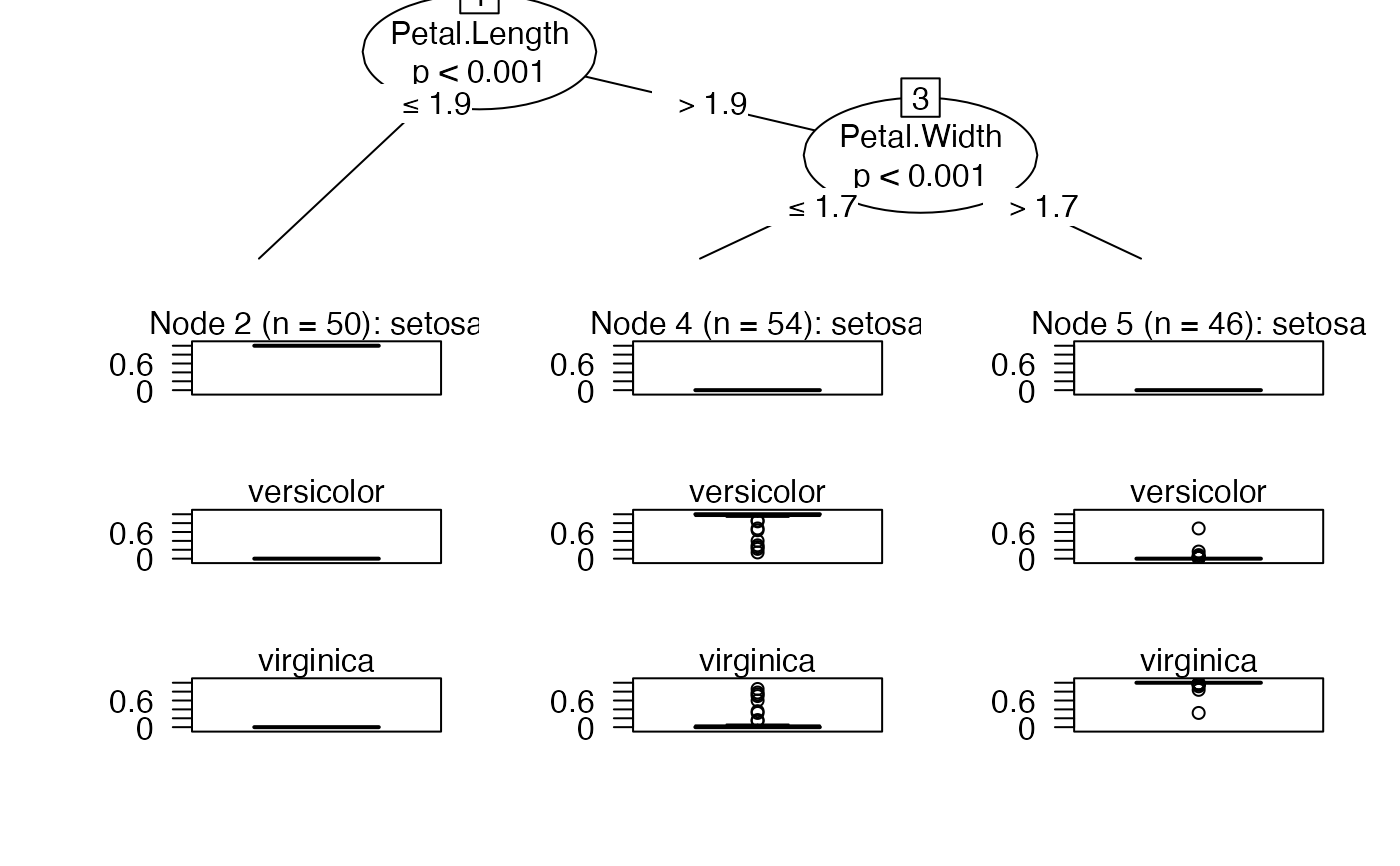
# If you want to visualize the tree directly:
plot(dt$tree)


# Use the tree to predict new data
set.seed(42)
iris.sample <- X[sample(1:nrow(X), 10), ]
predict(dt, iris.sample)
#>     setosa versicolor  virginica
#> 49       1 0.00000000 0.00000000
#> 65       0 0.90518519 0.09481481
#> 74       0 0.90518519 0.09481481
#> 146      0 0.02347826 0.97652174
#> 122      0 0.02347826 0.97652174
#> 150      0 0.02347826 0.97652174
#> 128      0 0.02347826 0.97652174
#> 47       1 0.00000000 0.00000000
#> 24       1 0.00000000 0.00000000
#> 71       0 0.02347826 0.97652174
predict(dt, iris.sample, type = "class")
#>        .class
#> 1      setosa
#> 2  versicolor
#> 3  versicolor
#> 4   virginica
#> 5   virginica
#> 6   virginica
#> 7   virginica
#> 8      setosa
#> 9      setosa
#> 10  virginica

# Extract the dataset
dat <- dt$results
head(dat)
#>   Sepal.Length Sepal.Width Petal.Length Petal.Width .node               .path
#> 1          5.1         3.5          1.4         0.2     2 Petal.Length <= 1.9
#> 2          4.9         3.0          1.4         0.2     2 Petal.Length <= 1.9
#> 3          4.7         3.2          1.3         0.2     2 Petal.Length <= 1.9
#> 4          4.6         3.1          1.5         0.2     2 Petal.Length <= 1.9
#> 5          5.0         3.6          1.4         0.2     2 Petal.Length <= 1.9
#> 6          5.4         3.9          1.7         0.4     2 Petal.Length <= 1.9
#>   .y.hat.setosa .y.hat.versicolor .y.hat.virginica .y.hat.tree.setosa
#> 1             1                 0                0                  1
#> 2             1                 0                0                  1
#> 3             1                 0                0                  1
#> 4             1                 0                0                  1
#> 5             1                 0                0                  1
#> 6             1                 0                0                  1
#>   .y.hat.tree.versicolor .y.hat.tree.virginica
#> 1                      0                     0
#> 2                      0                     0
#> 3                      0                     0
#> 4                      0                     0
#> 5                      0                     0
#> 6                      0                     0