plot.FeatureEffect() plots the results of a FeatureEffect object.
# S3 method for class 'FeatureEffect'
plot(x, rug = TRUE, show.data = FALSE, ylim = NULL)
Arguments
- x
A FeatureEffect object.
- rug
logical
Should a rug be plotted to indicate the feature distribution? The rug will be jittered a bit, so the location may not be exact, but it avoids overplotting.- show.data
(
logical(1))
Should the data points be shown? Only affects 2D plots, and ignored for 1D plots, because rug has the same information.- ylim
(
numeric(2))
Vector with two coordinates for the y-axis. Only works when one feature is used in FeatureEffect, ignored when two are used.
Value
ggplot2 plot object
See also
Examples
# We train a random forest on the Boston dataset:
if (require("randomForest")) {
data("Boston", package = "MASS")
rf <- randomForest(medv ~ ., data = Boston, ntree = 50)
mod <- Predictor$new(rf, data = Boston)
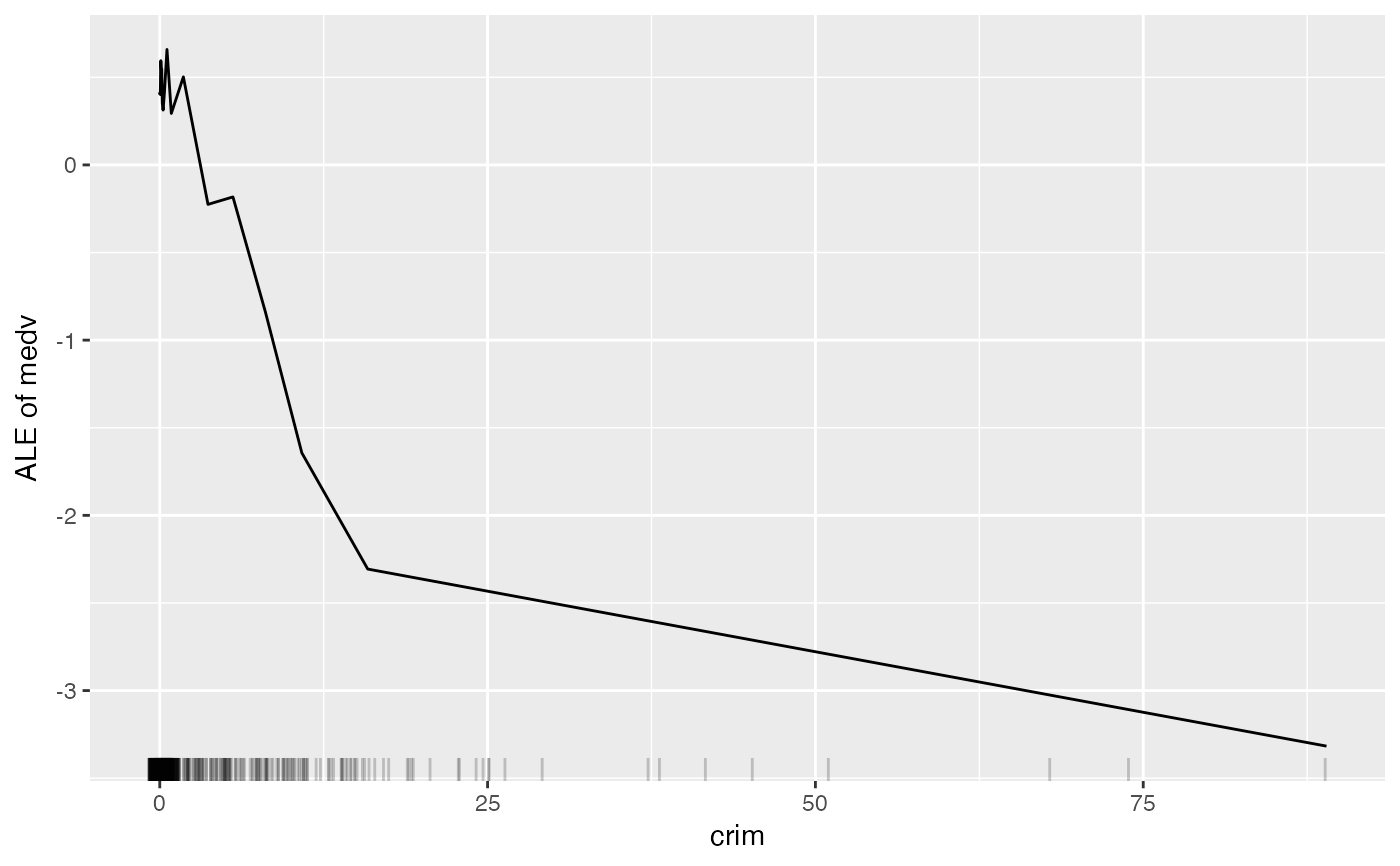
# Compute the ALE for the first feature
eff <- FeatureEffect$new(mod, feature = "crim")
# Plot the results directly
plot(eff)
}