plot.FeatureEffect() plots the results of a FeatureEffect object.
# S3 method for class 'FeatureEffects'
plot(x, features = NULL, nrows = NULL, ncols = NULL, fixed_y = TRUE, ...)
Arguments
- x
A FeatureEffect object.
- features
character For which features should the effects be plotted? Default is all features. You can also sort the order of the plots with this argument.
- nrows
The number of rows in the table of graphics
- ncols
The number of columns in the table of graphics
- fixed_y
Should the y-axis range be the same for all effects? Defaults to TRUE.
- ...
Further arguments for
FeatureEffect$plot()
Value
grid object
Details
In contrast to other plot methods, for FeatureEffects the returned plot is not a ggplot2 object, but a grid object, a collection of multiple ggplot2 plots.
See also
Examples
# We train a random forest on the Boston dataset:
library("randomForest")
data("Boston", package = "MASS")
rf <- randomForest(medv ~ ., data = Boston, ntree = 50)
mod <- Predictor$new(rf, data = Boston)

# Compute the partial dependence for the first feature
eff <- FeatureEffects$new(mod)

# Plot the results directly
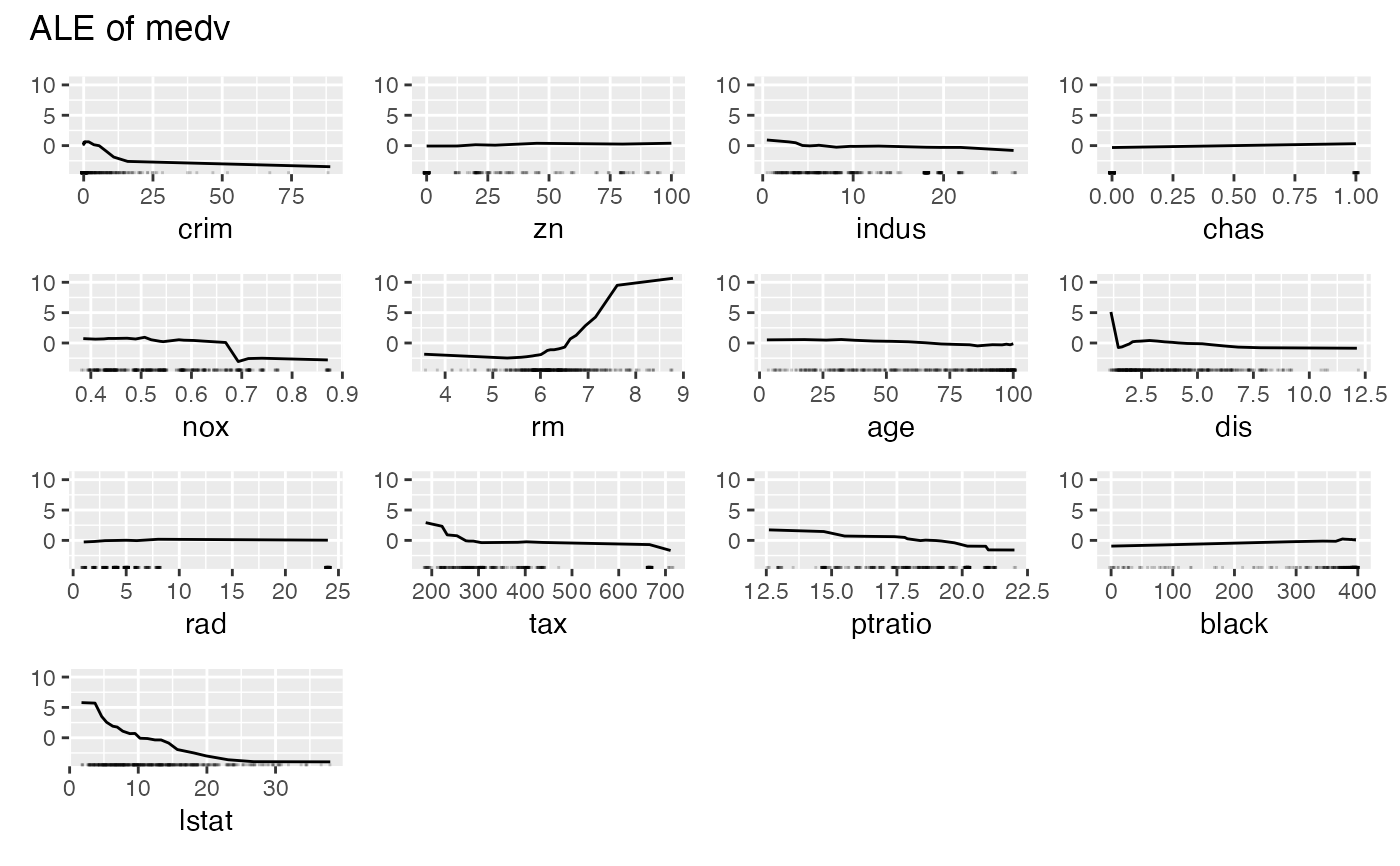
eff$plot()


# For a subset of features
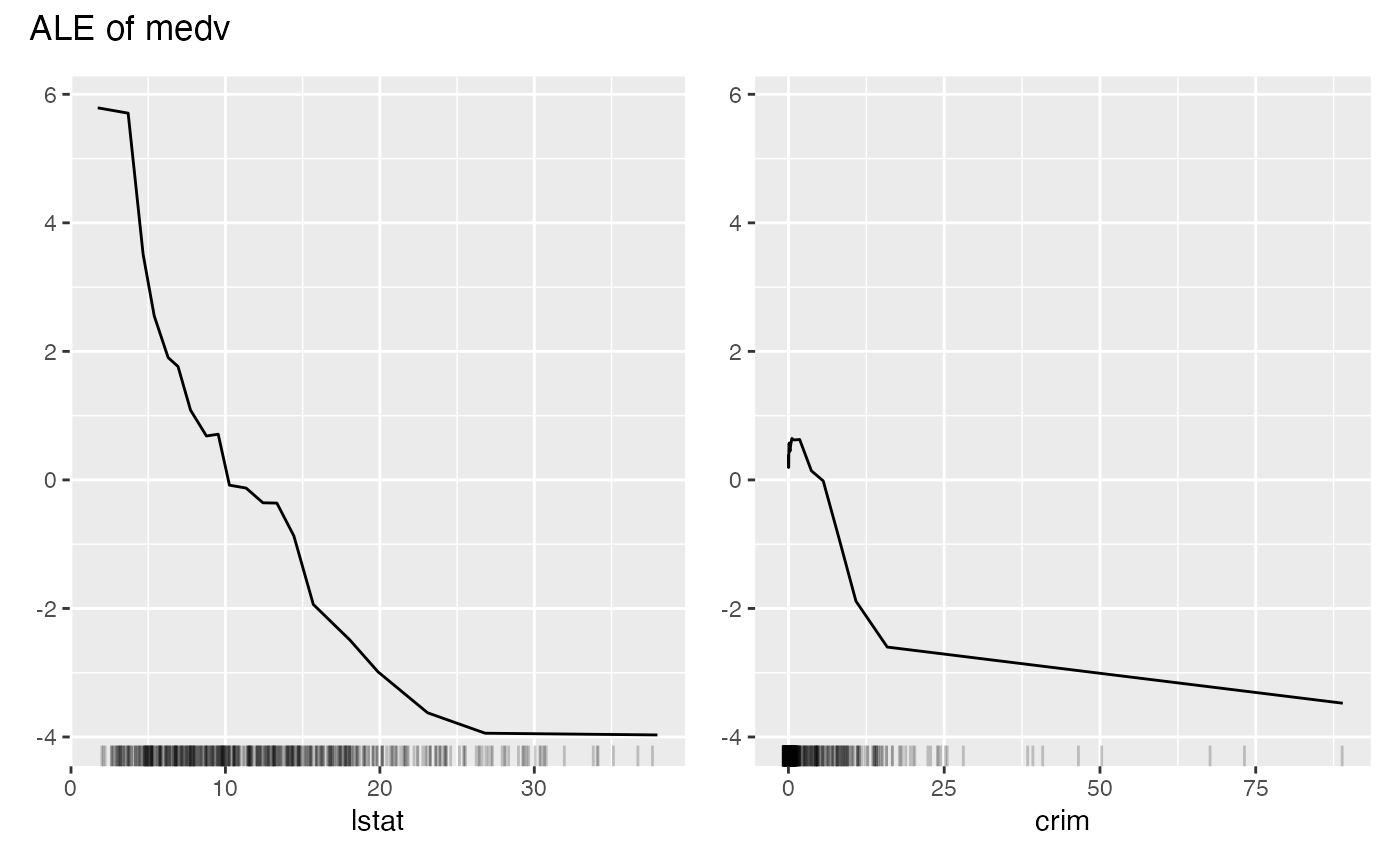
eff$plot(features = c("lstat", "crim"))


# With a different layout
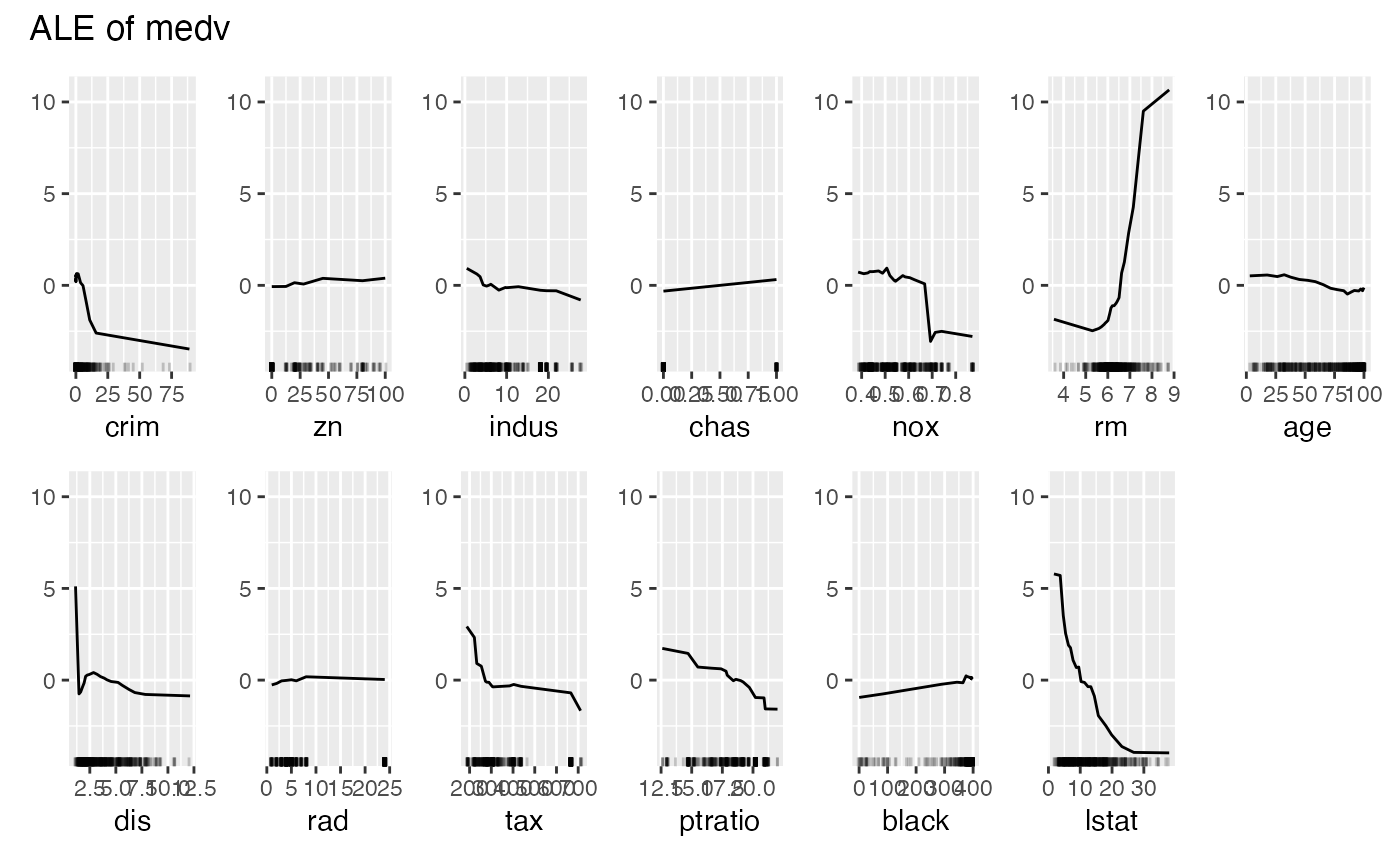
eff$plot(nrows = 2)
